
Contents
- The Basics
- What Is Market Capitalization and How Is It Determined?
- How Is the Price Actually Determined?
- What is available supply?
- Other Standard Metrics
- 24-hour volume
- 1h & 24h change
- Useful Websites To Keep Track of Crypto Prices
- Cryptocurrency Market Capitalizations at coinmarketcap.com
- Cryptocurrencies overview at kriptomat.io
- Cryptoasset rankings & metrics at onchainfx.com
- Mobile apps
- Crypto Market App
- CoinCap
- Bitcoin Ticker Widget
- Personal Portfolio Trackers
- Blockfolio
- CryptoCompare
- Any questions?
Even if you’re new to the whole bitcoin market or the market of cryptocurrencies in general, I would guess that you’ve at least taken a peek at the popular crypto-price tracking websites like coinmarketcap or a plethora of its brothers and sisters. If not, and you want to learn more about keeping track of crypto prices, then you came to the right place.
Keep in mind that this article is aimed at complete crypto beginners so some explanations might be simplified.
The Basics
Let’s first familiarize ourselves with the most basic metrics of any price tracking website.
What Is Market Capitalization and How Is It Determined?
You will probably notice that cryptocurrencies are usually ranked by something called market capitalization.
Market capitalization or market share is the mainstream way of ranking cryptocurrencies by their relative size. It is calculated by multiplying the current price with the circulating supply.
Market Cap = Price * Circulating Supply
Let’s take bitcoin as an example. The current bitcoin value or (more accurately) price is $6,854 and there are 16,958,812 bitcoins in circulation. If we multiply these two numbers, we get a market cap of $116.2 billion.
Bitcoin market cap = $6,854 * 16,958,812 = $116,235,697,448
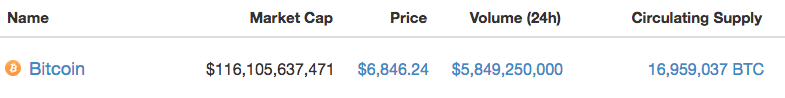
The entire crypto market cap is currently at $255 billion and bitcoin’s market share is about 45%.
How Is the Price Actually Determined?
It is determined based on scarcity, utility, supply and demand. Bitcoin, by the very nature of its design, is scarce. There is currently 16.9 million BTC in circulation and there will only ever be 21 million. Bitcoin also has certain valuable use cases, like being a global payment system and a decentralized digital currency. These elements create value by which price is determined based on supply and demand.
But the price can change very quickly. This is called volatility. The bitcoin market is still very tiny compared to some other industries, so it doesn’t really take a lot of money to move the market price up or down.
What is available supply?
Sometimes also called circulating supply. I think that this term is pretty self-explanatory. It is simply the total number of coins or tokens on the market. Due to certain design characteristics, most cryptocurrencies still don’t have all of the coins in circulation, and won’t have for quite a while.
A rule of thumb is that the higher the supply, the lower the coin price. Bigger supply leads to smaller demand and a smaller supply leads to bigger demand.
Some websites give you the ability to check the theoretical (or implied) market cap of a cryptocurrency if all the coins were already in circulation. This metric is a bit misleading because the dynamics of supply and demand would invariably change, but it is an interesting speculative tool. For example, bitcoin has always comfortably been in first place based on market cap, but XRP’s theoretical market cap very briefly took the first place in January 2018.
Other Standard Metrics
24-hour volume
Usually displayed in dollar price. It is the total amount of currency that has been circulated in the last 24 hours. In other words, it is the total volume of buys and sells. The more people are buying and selling, the larger the volume.
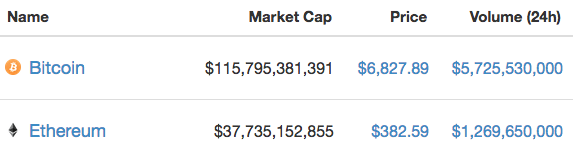
If we compare bitcoin to ethereum (2nd in the market cap), we can see that its volume is about five times larger. But keep in mind that this is only in the last 24 hours. The popular cryptocurrencies usually have a higher volume, which makes them a bit of a safer investment because it makes it harder to manipulate their price.
1h & 24h change
Usually displayed in percentages. It is the price change of a given currency in a given timeframe. For example, if a coin drops from $100 to $50 in the last 24 hours, the chart would display a change of -50%. Charts often have an option to display the change in the last hour and in the last 24 hours, but it is useful to check other timeframes as well.
What you focus on will depend on your interests as a trader or as an investor. The former are usually more interested in the short term, and the latter are usually interested in the long term.
Useful Websites To Keep Track of Crypto Prices
If you search for “coin market cap” on google, you will undoubtedly find plenty of results. Think about your needs and pick accordingly. I can offer some suggestions below.
Cryptocurrency Market Capitalizations at coinmarketcap.com
Relatively simple to use and probably the most popular website for market tracking. But in early 2018 they caused some minor panic and discontent by delisting certain Korean exchanges. The latter had higher coin prices than the rest of the market and delisting them meant that a lot of the coins were suddenly displaying much lower prices. This briefly sent the market into a bit of a tailspin as traders started selling for mistakenly believing that the prices were falling organically.
But the site still has a lot of redeeming features. One of the more interesting ones is the ability to check the market dominance chart. We briefly touched on the subject when we calculated bitcoin’s market share to be at 45%.
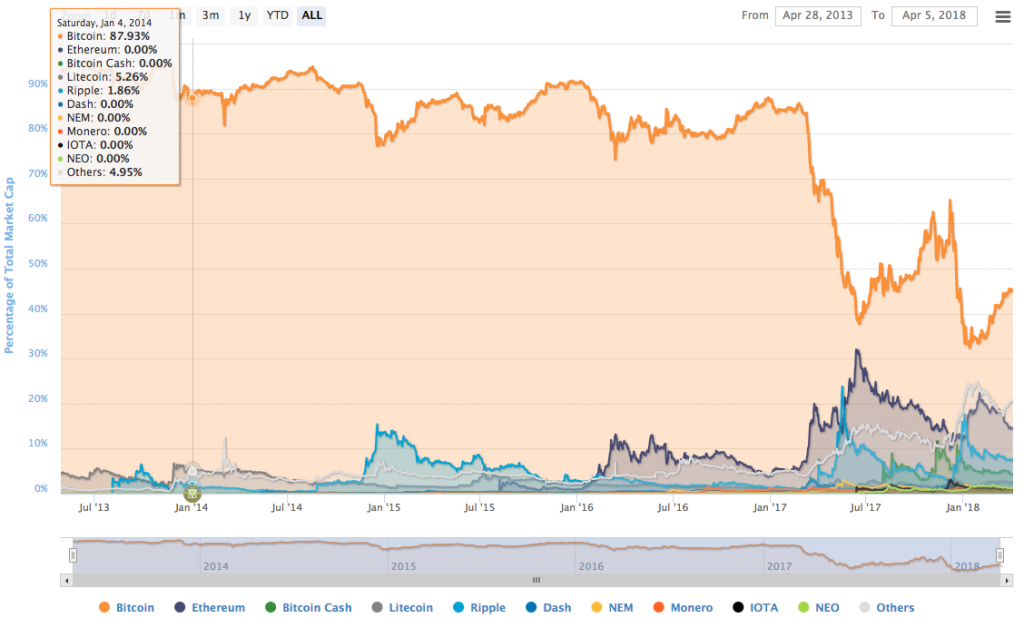
The dominance chart is basically the coin’s market cap divided by the combined market cap of all the listed cryptocurrencies. Bitcoin had a dominance of over 80% for a large portion of its lifetime, but this began to rapidly change in 2017 when a huge number of other coins started to enter the market. In June 2017 there was even a brief scare that ethereum might take the number one spot, but other than that, bitcoin’s dominance remains largely unchallenged.
Cryptocurrencies overview at kriptomat.io
Very simple and suitable for beginners. One of the benefits is that it automatically updates the prices and other metrics, so there is no need to refresh the page. It also contains some useful explanations at the bottom of the page.
Cryptoasset rankings & metrics at onchainfx.com
Slightly more advanced and intended for more experienced traders. Their chart also shows the theoretical (implied) market cap and a whole lot of other useful metrics.
I like the “Supply % Issued” column which shows the percentage of coins already in circulation. We can see that bitcoin already has over 80% of coins available on the market, but the last coin is expected to be mined in 2140.
Mobile apps
If you want to have sore eyes from always checking crypto prices, then mobile is the way to go. There are many useful tracker apps and widgets, some of the most popular ones are listed below.
Crypto Market App
The app is still said to be in beta, but it already offers pretty much everything that a beginner could need. Aside from seeing the prices of all the coins, you can choose your favourite ones, which will then be displayed in a separate tab. Clicking on any coin will show its general details, the chart, exchanges, etc. You can also set alerts and get a notification when the coin hits a certain price.
Plus the app has a really clever name.
CoinCap
This app pretty much has all the same features as Crypto Market App, but it is made for iOS.
Bitcoin Ticker Widget
You can use this widget to display the current prices right on your home screen. You can choose from more than a hundred coins from more than a hundred exchanges. The widget can currently show prices in four currencies (USD, EUR, CAD, JPY). You can also set custom refresh intervals and various different display options (show exchange name, daily high/low, etc.).
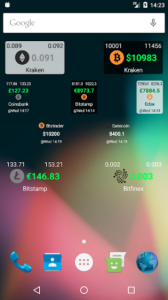
If you tap the widget you get a more detailed graph view.
Personal Portfolio Trackers
Portfolio trackers are a very useful tool for keeping a close eye on all of your investments. These services usually enable you to input buys and sells at particular prices, and then they display personalized price movements and percentage changes of your coins.
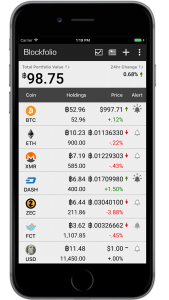
Blockfolio
This is probably one of the most widely used apps as it is relatively easy to use and is available for Android and iOS. It offers tracking of a couple of thousand cryptocurrencies. You can set price notifications and view your investments in most major fiat currencies. One possible drawback is the fact that it is only available for mobile.
CryptoCompare
CryptoCompare is available on desktop, so it is slightly more advanced than its mobile counterparts, but the underlying functions remain the same. In its most simple terms, you enter the buy price and the number of bought coins. Then you hope that you see more green than red (green being the color of profit and red being the color of loss).
Any questions?
Post in the comments below and we will be happy to answer!